Configure flow log aggregation
Big picture
Configure flow log aggregation level to reduce log volume and costs.
Value
Beyond using filtering to suppress flow logs, Calico Cloud provides controls to aggregate flow logs. Although aggressive aggregation levels reduce flow volume and costs, it can also reduce visibility into specific metadata of allowed and denied traffic. Review this article to see which level of aggregation is suitable for your implementation.
Concepts
Volume and cost versus visibility
Calico Cloud enables flow log aggregation by default using default aggregation levels that balance log volume with comprehensive visibility. The defaults assume that most users do not need to see pod IP information (due to the ephemeral nature of pod IP address allocation) for allowed traffic, but provides additional details on denied traffic that is more likely to need investigation. However, it all depends on your deployment; we recommend reviewing aggregation levels to understand what information gets grouped (and thus suppressed from view).
Aggregation levels
For allowed flows, the default aggregation level is 2, and for denied flows the default aggregation level is 1.
Level 0: no aggregation
Create separate flow logs for each distinct 5-tuple (protocol, source and destination IP and port) observed. This level is not recommended due to high log volumes.
Level 1: aggregate source ports
Aggregate flow data relating to multiple connections that only differ in source port. This reduces log volume by discarding source port information, which is usually ephemeral and of little value.
Level 2: aggregate IPs and source ports
In addition to the above, aggregate flows that have related sources and destinations into a single log depending on the source and destination type.
- Pods created by the same pod controller (Deployments, ReplicaSets, etc.) are combined and identified by their common pod prefix,
- IP addresses in the same NetworkSet are aggregated under that shared NetworkSet,
- When no more precise identity is known, arbitrary IP addresses are aggregated to either public (
pub) and private (pvt) as defined in RFC1918.
Level 3: aggregate IPs, source and dest ports
In addition to the above, aggregate flows with different destination ports that otherwise share together.
This is intended to reduce log volumes in situations where a lot of network probing is expected (for example by nmap) but is not typically needed
unless log analysis indicates it will be beneficial.
Understanding aggregation level differences
Here are examples of pod-to-pod flows, highlighting the differences between flow logs at various aggregation levels.
By suppressing the source port, aggregation level 1 minimizes the flow logs generated for applications that make many connections to the same destination.
The two flows originating from client-a without aggregation are combined into one.
In Kubernetes, pod controllers (Deployments, ReplicaSets, etc.) automatically name the pods they create with a common prefix.
For example, the pods nginx-1 and nginx-2 are created by the ReplicaSet nginx. At aggregation level 2 that prefix is used to aggregate flow log entries and
is indicated with an asterisk (*) at the end of the name. The flows originating from client-a and client-b are combined into a single flow log.
Finally, level 3 combines flows between matching pod prefixes that target distinct destination ports, as seen in the last example row below.
Aggregation is currently performed on a per-node basis, but this behavior may change. Certain other fields are always kept separate
and not aggregated together such as action (i.e. denied traffic and allowed traffic will always be logged separately).
| Src Traffic | Dst Traffic | Packet counts | |||||||
|---|---|---|---|---|---|---|---|---|---|
| Aggr lvl | Flows | Name | IP | Port | Name | IP | Port | Pkt in | Pkt out |
| 0 (no aggregation) | 4 | client-a | 1.1.1.1 | 45556 | nginx-1 | 2.2.2.2 | 80 | 1 | 2 |
| client-b | 1.1.2.2 | 45666 | nginx-2 | 2.2.3.3 | 80 | 2 | 2 | ||
| client-a | 1.1.1.1 | 65533 | nginx-1 | 2.2.2.2 | 80 | 1 | 3 | ||
| client-c | 1.1.3.3 | 65534 | nginx-2 | 2.2.3.3 | 8080 | 3 | 4 | ||
| 1 (src port) | 3 | client-a | 1.1.1.1 | - | nginx-1 | 2.2.2.2 | 80 | 2 | 5 |
| client-b | 1.1.2.2 | - | nginx-1 | 2.2.2.2 | 80 | 2 | 2 | ||
| client-c | 1.1.3.3 | - | nginx-2 | 2.2.3.3 | 8080 | 3 | 4 | ||
| 2 (+src/dest pod-prefix) | 2 | client-* | - | - | nginx-* | - | 80 | 4 | 7 |
| client-* | - | - | nginx-* | - | 8080 | 3 | 4 | ||
| 3 (+dest port) | 1 | client-* | - | - | nginx-* | - | - | 7 | 11 |
How to
- Verify existing aggregation level
- Change default aggregation level
- Troubleshoot logs with aggregation levels
Verify existing aggregation level
Use the following command:
kubectl get felixconfiguration -o yaml
Change default aggregation level
Before changing the default aggregation level, note the following:
- Although any change in aggregation level affects flow log volume, lowering the aggregation number (especially to
0for no aggregation) will cause significant impacts to log storage. If you allow more flow logs, ensure that you provision more log storage. - Verify that the parameters that you want to see in your aggregation level are not already filtered.
Troubleshoot logs with aggregation levels
When you use flow log aggregation, sometimes you may see two Alerts,

along with two flow log entries. Note that the entries are identical except for the slight timestamp difference.
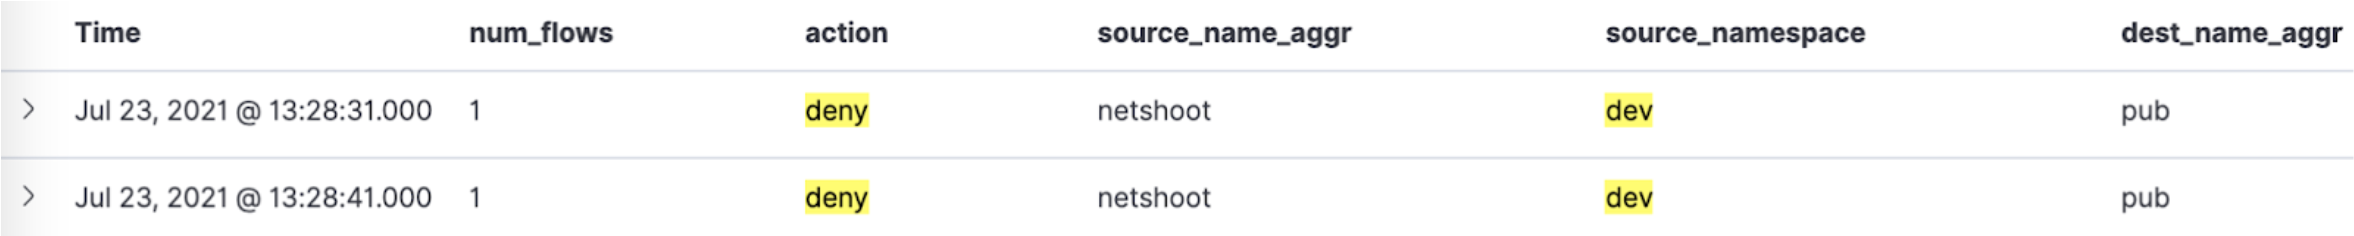
The reason you may see two entries is because of the interaction between the aggregation interval, and the time interval to export logs (flowLogsFlushInterval).
In each aggregation interval, connections/connection attempts can be started or completed. However, flow logs do not start/stop when a connection starts/stops. Let’s assume the default export logs “flush” time of 10 seconds. If a connection is started in one flush interval, but terminates in the next, it is recorded across two entries. To get visibility into flow logs to differentiate the entries, go to Service Graph, flow logs tab, and look at these fields: num_flows, num_flows_started, and num_flows_completed.
The underlying reason for this overlap is a dependency on Linux conntrack, which provides the lifetime of stats that Calico Cloud tracks across different protocols (TCP, ICMP, UDP). For example, for UDP and ICMP, Calico Cloud waits for a conntrack entry to timeout before it considers a “connection” closed, and this is usually greater than 10 seconds.